Analytics
Analytics
Are we in the Black?
This is the status quo. It’s essentially a simple equation.
How much we bid - How much we spent = In the black / Not in the black.
In other words, “Are we still in business today?” is the standard.
And how much of a margin the studio actually made is really only known by a handful of people at the top of our industry. Everyone else finds out the same way: either the next show gets greenlit, or the layoffs start.
That number tells you whether you made money. It tells you nothing about why. You can’t fix a show you can only measure after it’s over.
How long did we spend on each task?
Another level of analytics is time tracking - how many hours have we billed against each task. This is incredibly hard for studios to track. I’ve seen it tracked to varying degrees of success, but if the data isn’t accurate, it’s worse than useless: it gives you confident answers to the wrong questions.
And it’s almost never accurate, because of how it’s collected. An artist fills in a timecard on Friday afternoon, from memory, against a list of task codes that don’t quite match what they actually did. The two hours they lost fighting a broken export get logged against “Modeling” because there’s no code for “fighting a broken export”. The data says modeling is expensive. The truth is that the pipeline is expensive, and it’s hiding inside the art.
So we end up with two numbers: one that’s accurate but useless (the bottom line), and one that’s useful but inaccurate (the timecard).
Trajectory: What did we do, when did we do it?
Things get fun when we have trajectory data. Not what someone says they did, but a record of what actually happened, in order, captured by the system as it happened. For creative tasks as well as code.
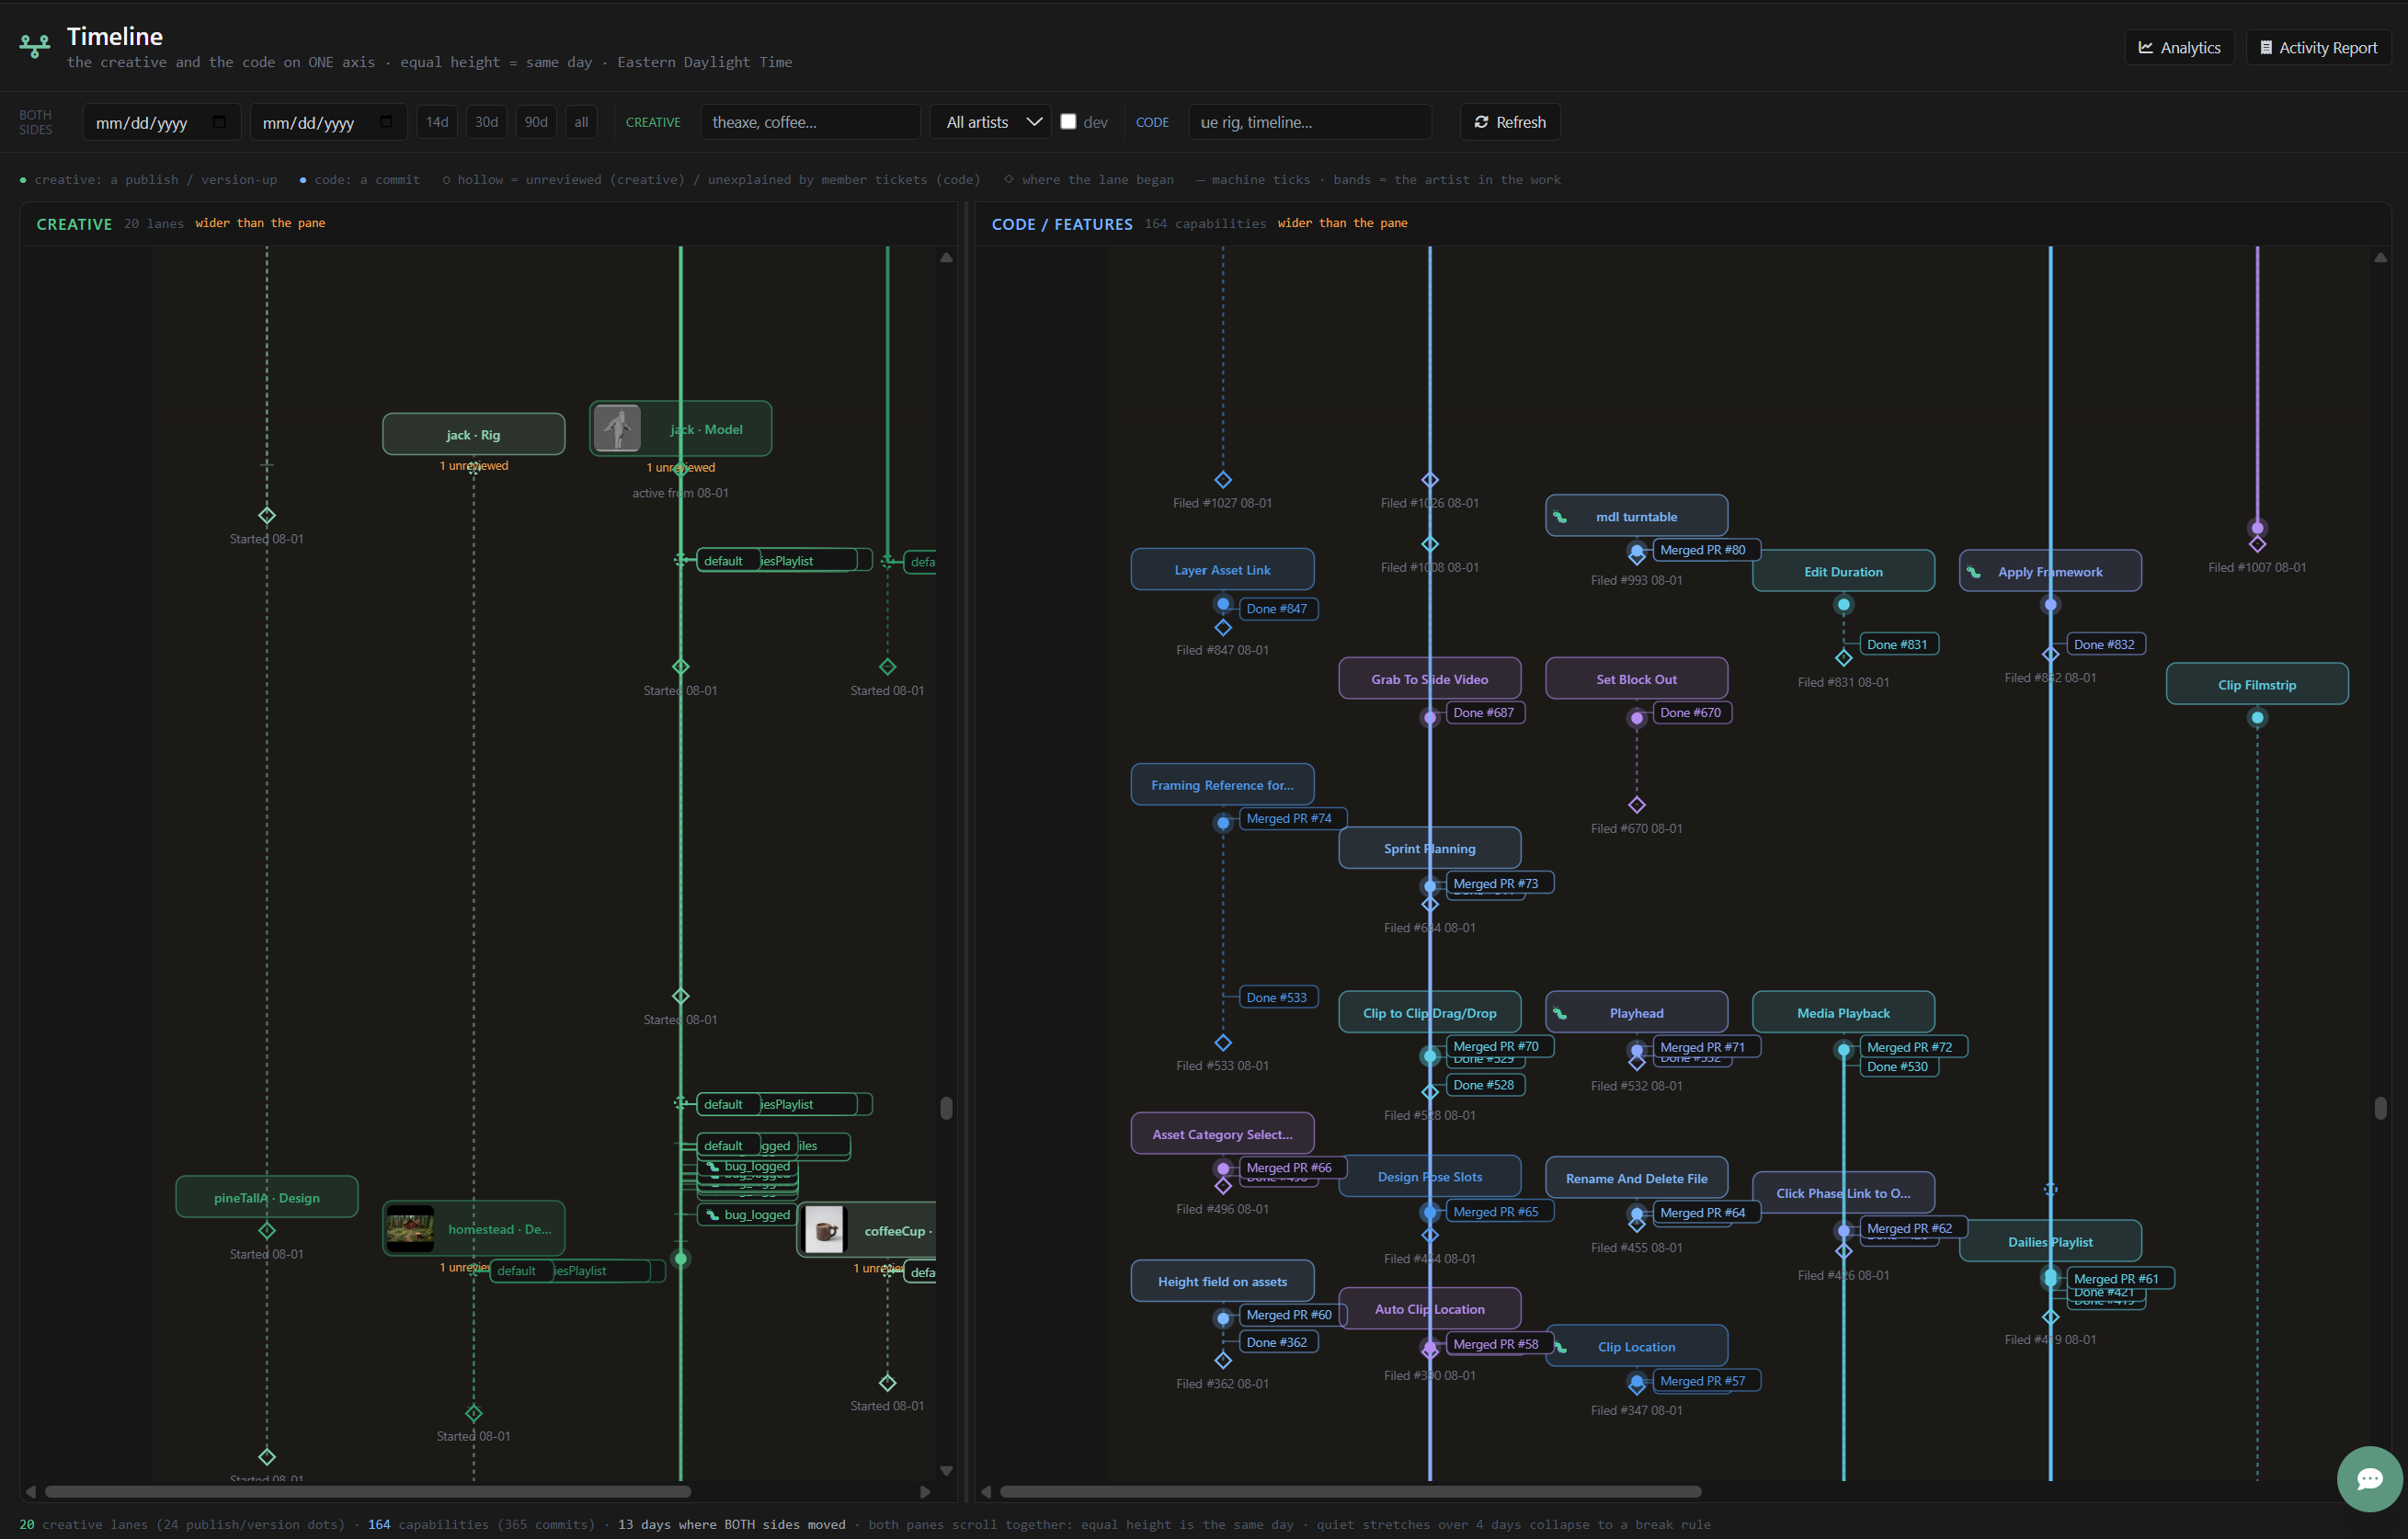
This is the timeline from The Legend of Jack - a web series i’m working on in my free time. The left side is the creative work. The right side is the code - the pipeline itself being built. They share one vertical axis: equal height is the same day.
A few things you can read off this at a glance:
- Every lane is a piece of work.
jack · Model,coffeeCup · Rig,axe · Design. Twenty creative lanes, each with a diamond where it started and a dot every time a new version was published. - The machine work is visible, and separated from the art. Every publish fires the same chain of steps:
CheckForReviewFiles,CreateJpgProxies,CreateReviewMedia,GenerateThumbnails,MarkForReview,AddToDailiesPlaylist. Those are the technical chores from the DOWNTIME essay - except here, nobody did them by hand, and every one of them is logged. - Bugs land on the work they interrupted. The
videos_theaxe_seq_prvlane has eighteenbug_loggedmarks on it. That’s not a bug count in a tracker somewhere - that’s a picture of exactly which shot was suffering, and when. - Review state is visible. A hollow dot is a version nobody has looked at yet. “3 unreviewed” on a lane is a queue you can see, not one you have to ask about.
- The code side explains itself. 164 capabilities, 365 commits, and every commit hangs off a ticket and a feature. When a commit doesn’t belong to a ticket, it shows up hollow - “11 unexplained” on the Kanban Board. That’s not a judgment, it’s a question worth asking.
- You can see cause and effect. 13 days where both sides moved. When a bug lands on the creative side, you can look straight across and see the fix land on the code side - or see that it didn’t.
None of that came from a timecard. Nobody filled anything in. It’s a side effect of doing the work.
And this is where it gets interesting, because now we can ask questions the bottom line can’t answer:
- How long between “started” and the first version? Between a version and its review?
- How many machine steps ran for every human decision?
- Which lanes are generating bugs, and which pipeline features are generating them?
- When we built a feature, did the creative lane it was meant for actually speed up?
That last one is the one studios never get to ask. We spend money on tools, and we spend money on artists, and we have no way to connect the two.
The systems required
Here’s the catch. You can’t buy this chart. You can’t bolt it on at the end of a show. It’s what falls out when a handful of systems are already in place - and if any of them is missing, the picture breaks.
1. A task registry - a name for every piece of work
Every lane on that chart is an asset · task. Before anything can be tracked, the work has to have a name the whole pipeline agrees on. This is naming conventions doing real work: if the file on disk, the task in the tracker, and the version in review don’t share an identity, they can’t share a timeline.
2. Publishing - every meaningful save is an event
The dots are publishes. If artists hand files around through chat and shared drives, there are no dots. A publish step - versioned, attached to its task, stamped with who and when - is the single most important source of analytics data in a studio, and most studios treat it as a chore.
3. Automated steps that log themselves
The chain of CreateJpgProxies → GenerateThumbnails → MarkForReview is only visible because each step is a discrete, named, logged unit of work rather than a script someone runs by hand. Automate the chores and you get the measurement for free. Leave them manual and they stay invisible - buried inside the art.
4. Review as a state, not a meeting
Hollow vs. filled is only possible if “has this been reviewed?” is recorded on the version itself. If review lives in someone’s notes from dailies, you can’t count the queue.
5. Code tied to tickets, tickets tied to capabilities
The right-hand side only works because every commit and PR points at a ticket, and every ticket belongs to a capability. That’s what lets us say “this is the feature, this is when it shipped, this is what it cost” - and then look left to see what it did for the artists.
6. Timestamps the machine captures, not the person
The whole thing rests on time captured automatically: file timestamps, publish times, commit times. The moment you rely on someone to remember when they did something, you’re back to the Friday afternoon timecard.
7. One clock
Creative and code on one axis. It sounds trivial, but most studios keep production data in one system and engineering data in another, with no shared timeline between them. Put them side by side and the questions ask themselves.
Why it matters
Bid minus spend tells you if you survived. Timecards tell you a story people remembered. Trajectory tells you what happened.
The point isn’t the chart. The point is that once the systems are in place, the chart is free - and so is every question you’d want to ask of it. The studios that can answer “where did the time go?” with data instead of opinion are the ones that get to fix it on this show, instead of finding out at the wrap party.